4 posts tagged with "amazon"

View All Tags

· 3 min read
Nicholas Coughlin

First, what do we mean when we say branded keywords.

Branded keywords include the brand name or trademarks associated with a specific seller or manufacturer. These might be "Nike running shoes" or "Apple iPhone charger." These keywords target consumers who are already familiar with the brand and are likely looking for products specifically from these companies.

Non-branded keywords, on the other hand, are generic and do not include brand names. Examples would be "running shoes" or "smartphone charger." These keywords target a broader audience and are used by consumers who are not necessarily committed to a particular brand but are in the market for a specific type of product.

Before we can make a ruling on this we need to talk about an important distinction. There are actually two different subclasses of branded keywords. Offensive and Defensive.

Offensive vs Defensive Brand Keywords

Offensive brand keywords include your competitors brand names. If we use the competitors brand name in our keywords we are going on the offensive and trying to steal their clicks.

Defensive brand keywords include our brand name. If we pay for these clicks we are defending against other brands that are targeting us.

tip

Brand competition is one of the listed secondary strategies in the PPC Guide Amazon Ads PPC Guide > Intermediate > Campaign Strategies

Should You Use Defensive Branded Keywords?

Running "Defensive" branded campaigns can be seem very appealing as they almost always have amazing conversion rates and extremely low ACoS numbers.

This is extremely deceptive.

Because we are targeting customers who were already looking specifically for your product we would expect these numbers to be high. You will already be in the top of the organic search results without the advertisement. In most cases this is a waste of money. You are just paying needlessly for clicks that you would have gotten for free organically.

There have been studies run on this and the takeaway is that it is a purely strategic (IE non-profitable) campaign strategy for brands that are already at the top of the organic search results. Taking a loss to prevent the possibility of competitors edging in.

If this isn't you, don't even consider it.

Should you use Offensive Branded Keywords?

The primary goal of offensive keyword strategies is to intercept potential customers by appearing in searches meant for your competitors. The click-through-rate on these advertisements will be bad, and they will almost certainly be more expensive than generic keywords. However... if you test them and the following series of unlikely things is true:

  • they have a conversion rate that is comparable to your generic keyword campaigns
  • they have an ACoS that is within your acceptable range
  • the budget on this campaign could not be used more profitably in another campaign

Then yes, the offensive branded campaign is viable and you should keep running it. It will expand your market share.

Some people will even decide to do this at a loss for strategic purposes to build market share and organic sales in the long run, while taking a temporary loss.

Conclusion

So should you run branded keyword campaigns? The answer is almost certainly not. Minus the exceptions listed above.

· 6 min read
Nicholas Coughlin

First let's define what we mean by an Amazon Performance Report. A performance report is the combination of the sales data from Seller Central with the advertising reports from Amazon Ads, into one new merged report that gives an overhead view of account and product performance.

The idea is that we cannot get the full picture of how we are performing with just half of the data. The Seller Central reports do not tell us how much we are spending on advertising, and the advertising reports do not tell us what our total sales are. We have to merge the two.

Secondly a performance report will typically include several advertising specific sections, which we will review below.

What does a typical Amazon Performance Report look like?

We will have to generalize a little bit here, because every individual advertising firm or manager will do things a little bit differently. But there are some report details that we know for sure will be in every professional Amazon Performance Report (or should be).

info

For basically every report section listed here, if you store the data over time you can create a time-series for these values to see how they trend. I'm not going to say this again in every section, so just take note of that now and assume it for every report section listed below.

Account Summary Section

The first key section of the report will typically be the account summary. This will usually have the following metrics aggregated for the whole account over a given time period (typically the last month).

  • Total Sales
  • Ad Spend
  • Ad Revenue
  • Ad Revenue Percentage
  • ACoS
  • TACoS
  • ROAS
  • Ad Impressions
  • CTR
  • Ad clicks
  • Ad Orders
  • Conversion Rate
  • CPC
tip

If you're unsure what some of these acronyms are or how to calculate them check out the terminology section of our guide: Amazon Ads PPC Guide > Beginner > Terminology

The majority of these metrics come from the advertising reports, but the absolutely key Total Sales value comes from Seller Central reports and is used to calculate several of the other metrics.

Product Performance Section

A professional Amazon Performance Report will always include a product performance section. This is essentially the exact same as the account summary section, but the metrics are grouped by product.

In fact, performance reports can really only be grouped these two ways (by account and product) because those are the only groupings available to us for Total Sales in Seller Central reports.

Organic vs Ad Revenue Section

This section is intended to show the ratio or volume of organic vs paid revenue over time. The idea being that ideally we want to show an increase in organic revenue as time goes on. This is most informative as a time-series.

Advertising Specific sections

In addition to the merged performance sections that include total sales metrics, there will typically be several advertising only metric sections afterwards.

These sections will typically be a standard set of advertising metrics, grouped in various ways. You can assume the advertising metrics will look something like this:

  • Ad Spend
  • Ad Revenue
  • Ad Clicks
  • Ad Impressions
  • CPC
  • CTR
  • ACoS
  • Conversion Rate

These metrics can then be grouped by Campaign Type (Sponsored Products, Sponsored Brands, Sponsored Display), target type, target match type and placement.

Gathering data

tip

Bidbear automates the process of downloading and merging this data into comprehensive performance reports. So if you want to skip this busywork and get a bunch of other benefits consider using our service bidbear.io

Seller Central data

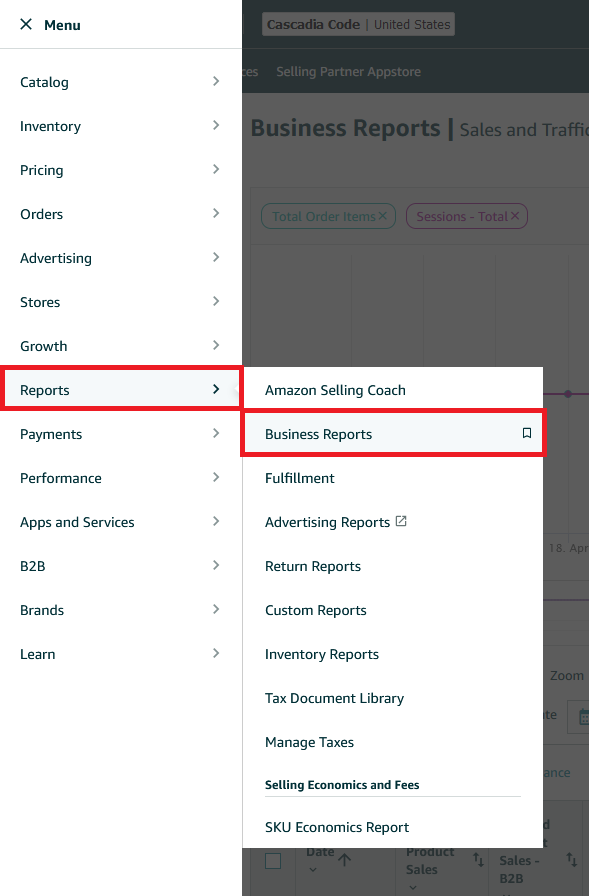
Seller Central is where we get our total sales values. To find them log in to Seller Central and then go Menu > Reports > Business Reports. If that menu is not visible, you are logged in with the wrong account, or you have not been given access by the account owner.

reports in Menu

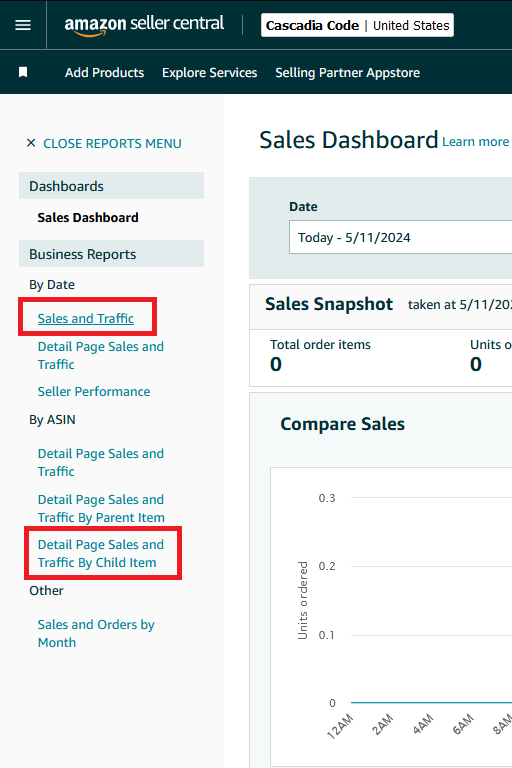
from there the two main reports that you will want to download are the Sales and Traffic report, and the Detail Page Sales and Traffic by Child Item (or parent item if you prefer).

sales and traffic report, and detail page sales and traffic by child item

Those will give you the total sales values for the whole account, and by product respectively.

Amazon Advertising data

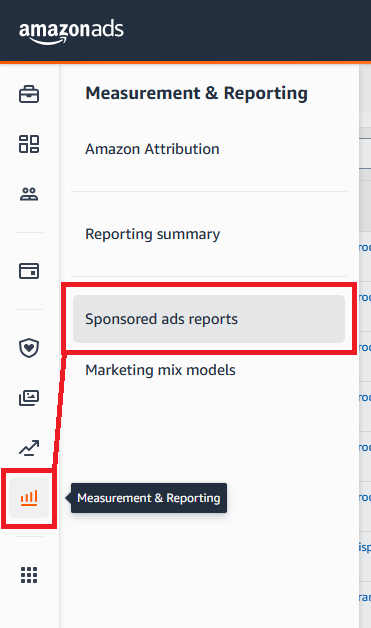
Now let's get all the advertising data. Log into Amazon Advertising and on the sidebar you'll go Measurements & Reporting > Sponsored Ads Reports.

Measurements & Reporting > Sponsored Ads Reports

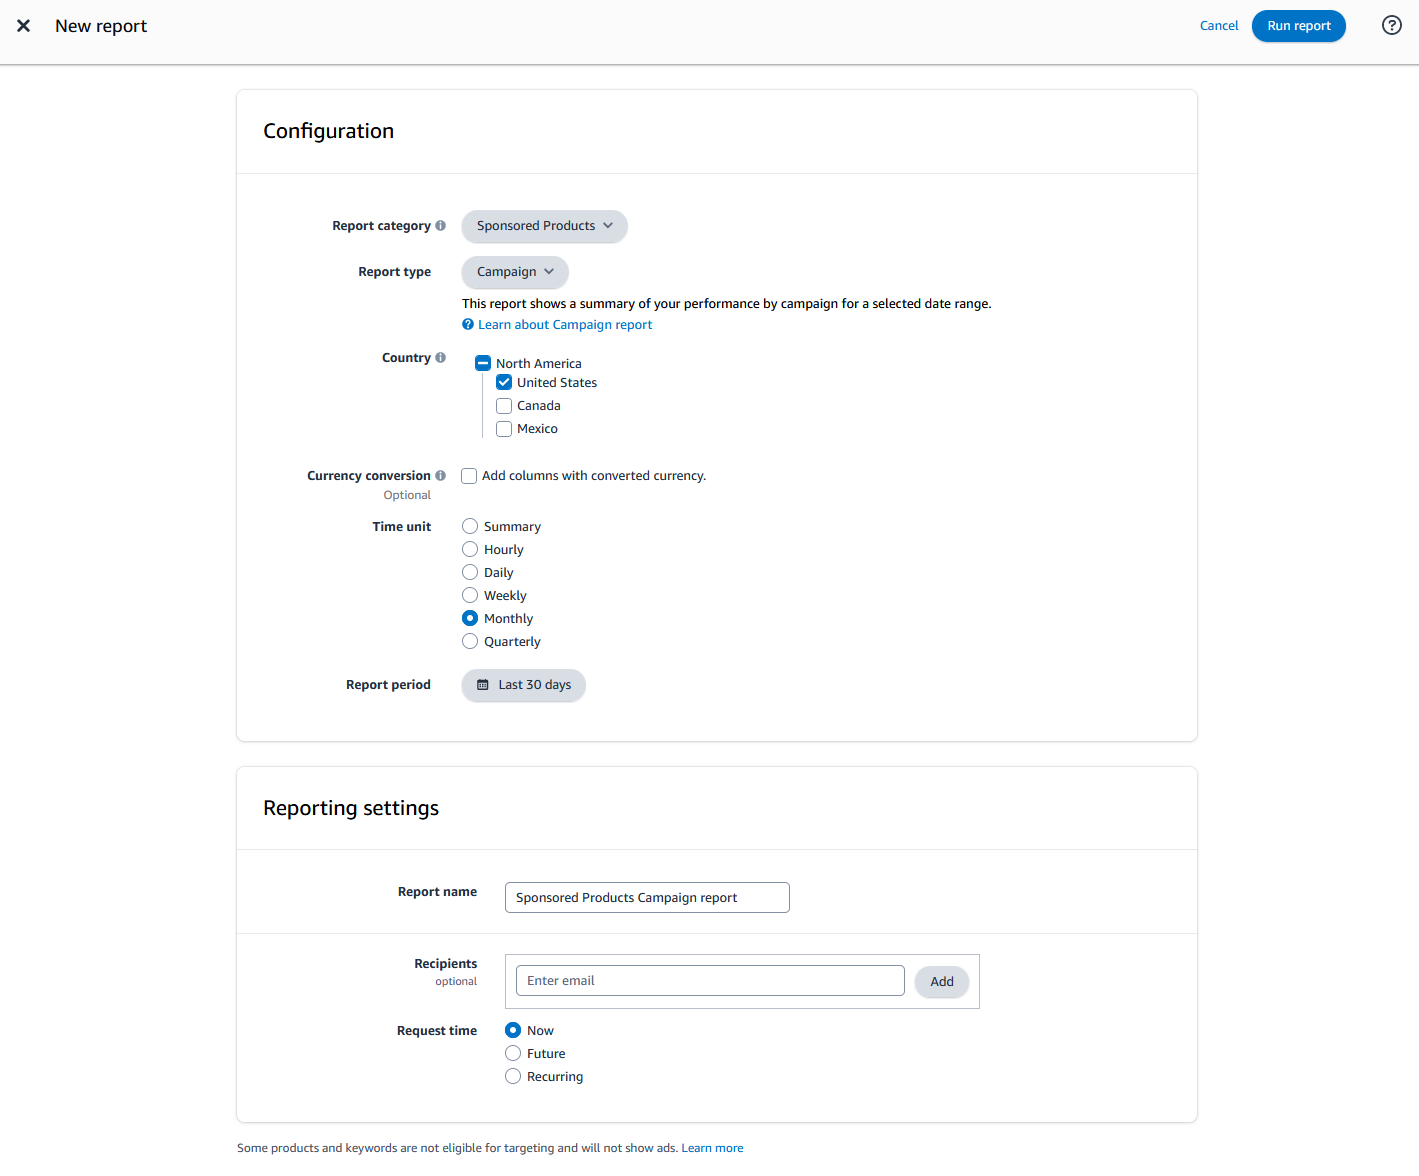
You'll need to create a new report. The reports are segmented by ad type, so you'll need to download three total reports minimum and combine them to get all the data.

For Report Type select Campaign. You will simply sum the total for all the campaigns, and then sum all of those sums for the different ad types to get your total advertising values.

tip

Name the report something you will remember and then next time you can just request this report again.

create a new report

The report will take a minute to generate, but when it's done you download the three reports (one for each ad type) and combine them together in your spreadsheet.

To get the data grouped by product for the Product Performance section of your report, you will simply repeat this process again, but when downloading the advertising reports set the report type to Advertised Product and the data will be grouped by product.

Conclusion

From here the process is simple, you combine the data in the spreadsheet application of your choice. I recommend you make a new spreadsheet for every type of report you want to make, and then a new tab for each time period. From there you can create a time-series, charts etc etc.

Once all those charts and table are done you combine them all in a presentation software like Powerpoint, and repeat the whole process every month.

If doing this on a monthly basis sounds tedious, check out bidbear.io. We automate this entire process and more.

· 6 min read
Nicholas Coughlin

For anyone managing Amazon Advertising campaigns, understanding the difference between these two metrics is critical. While they might sound similar, the insights they provide are distinct and cater to different aspects of your advertising and sales performance. This post will break down each metric, explain their differences, and discuss why both are essential for a comprehensive Amazon advertising strategy.

What is ACoS?

ACoS, or Advertising Cost of Sale, is a metric used to measure the efficiency of an Amazon advertising campaign. It is calculated by dividing the total spend on a specific advertising campaign by the revenue generated from that campaign:

ACoS=(Advertising SpendRevenue from Ads)×100ACoS = \left( \frac{\text{Advertising Spend}}{\text{Revenue from Ads}} \right) \times 100

ACoS tells you how much you are spending on advertising for every dollar of revenue you generate from those ads. A lower ACoS indicates a more cost-effective campaign (on the surface), as you are spending less to make a sale.

However as we will learn below, knowing the ACoS is not enough.

What is TACoS?

TACoS, or Total Advertising Cost of Sale, extends the concept of ACoS to provide a more holistic view of how advertising impacts overall sales. TACoS is calculated by dividing the total advertising spend by the total revenue (including both ad-driven and organic sales):

TACoS=(Advertising SpendTotal Revenue)×100\text{TACoS} = \left( \frac{\text{Advertising Spend}}{\text{Total Revenue}} \right) \times 100

TACoS helps you understand the broader impact of advertising on your total sales. It factors in how advertising may be driving organic sales growth, not just sales directly from ads.

info

While ACoS can be calculated using only the Amazon Advertising reports. To calculate TACoS you need a value for total sales, which is only available in Seller Central performance reports. That means you need to download reports from both location and combine them to get this metric.

The Difference Between ACoS and TACoS

While ACoS focuses strictly on the efficiency of your advertising campaigns in generating direct sales, TACoS provides insight into the overall impact of your advertising on your entire business. TACoS can be particularly insightful for understanding how much your advertising spend is influencing your total sales volume, including organic sales, which do not directly result from ads.

This is especially true if we track the change in these values over time.

info

For Example:

  • Let's assume that we have never run Amazon Ads before and this is our first month.
  • Let's say that my total sales on a monthly basis are typically $100.
  • Let's say that I spend $10 in advertising this month.

At the end of the month we check our advertising reports and see that our ads resulted in $50 in sales, giving us an ACoS of 20%.

That seems great, but we don't really know until we check our Total Sales.

If our total sales is still $100, our TACoS is 10%, and our total profit is down $10. We made the same amount of revenue but spent $10 more. Now maybe not so great.

In this case our advertisements did not increase our overall sales, and they decreased our profit.

The only point of this example is to illustrate that ACoS does not exist in a vacuum.

Why It Matters

ACoS alone is a good indicator of whether a particular advertisement is cost effective. However monitoring changes in TACoS and Ad Revenue percentage over time is the key to understanding how your advertising campaigns are really performing.

tip

Taking a loss in the short term is not necessarily bad. It depends on your overall strategy. You can read more about this in our Amazon Ads PPC Guide.

Amazon Ads PPC Guide > Intermediate > Short vs Long Term Profit

Understanding Ad Revenue Percentage

Ad revenue percentage is another critical metric that measures the portion of your total revenue that comes directly from your advertising efforts. It is calculated by dividing the revenue from ads by the total revenue, then multiplying by 100 to get a percentage:

Ad Revenue Percentage=(Revenue from AdsTotal Revenue)×100\text{Ad Revenue Percentage} = \left( \frac{\text{Revenue from Ads}}{\text{Total Revenue}} \right) \times 100

Relationship Between TACoS and Ad Revenue Percentage

Understanding the relationship between TACoS and ad revenue percentage is vital for Amazon sellers. A high TACoS might indicate that a significant portion of your total revenue is being consumed by advertising costs, which could suggest that your advertising is not as efficient as it could be, or it might indicate an aggressive growth strategy where heavy advertising is driving substantial organic sales growth.

Conversely, a low TACoS with a high ad revenue percentage might indicate that your ads are highly effective, driving a large portion of your total revenue at a lower relative cost. This scenario often points to strong ad performance but may also suggest potential underinvestment in advertising, where increasing ad spend could drive even more revenue.

Indications of High ACoS or TACoS

What is a high ACoS or TACoS and what does it mean if you have them?

High ACoS

A high ACoS means that a significant portion of your sales revenue from ads is being spent on the advertising itself. The threshold for what is considered "high" can vary:

General Benchmark

Typically, an ACoS over 30-40% may be considered high for many product categories. This means you are spending 30 to 40 cents on advertising for every dollar of sales.

Product Lifecycle

For new products, a higher ACoS may be acceptable initially as you are trying to gain visibility and traction. For established products, a lower ACoS is generally preferable to maximize profitability.

Profit Margins

If your product has very high profit margins, you might tolerate a higher ACoS. Conversely, for low-margin products, even a lower ACoS might be too high.

High TACoS

TACoS provides a broader view of how advertising spend impacts overall sales (both ad-driven and organic). It relates advertising spend to the total revenue:

General Benchmark

A TACoS above 10-15% might be considered high for many sellers. This indicates that a significant portion of your total revenue is being consumed by advertising costs.

Business Objectives

If the objective is aggressive growth and market capture, a higher TACoS might be acceptable as part of a strategic investment in customer acquisition.

Market Dynamics

In highly competitive markets or during high-traffic seasons (like holidays), TACoS may increase as advertisers spend more to capture consumer attention.

Strategic Considerations

High ACoS and TACoS

If both ACoS and TACoS are high, it may indicate inefficiencies in your advertising strategy, where the costs are not justified by the revenue generated directly by ads or the overall sales performance.

Balancing Act

Ideally, the goal is to balance ad spend with sales revenue in a way that maximizes profitability. Sellers should aim to optimize their advertising strategies to reduce ACoS and maintain a TACoS that supports sustainable business growth.

Ultimately, determining what is "high" for ACoS and TACoS should be based on your specific business context, goals, and the competitive landscape of your product category. Regularly reviewing these metrics in conjunction with other performance indicators will help adjust strategies to ensure advertising effectiveness and profitability.

· 5 min read
Nicholas Coughlin

These are the top 5 Amazon Advertising mistakes that even seasoned veterans might make.

1: Organization

Advertising campaigns get messy fast. The best advertising professionals use a standardized, organized structure to keep things neat and tidy. It's strongly recommended if you are the only person working on an account, and 100% essential if you are working on a team.

Standardized Naming Convention

The most important aspect of campaign organization is a standardized naming convention. Using a standard system you will get a name like this:

P|M|Sierra Sandal|DS|KT

Which tells me at a glance that I am looking at a Sponsored Products ad group with manual targeting, for the product Sierra Sandal, using the Discovery campaign strategy with keyword targeting.

Using a system like this allows you to filter your Campaigns and Ad Groups for things like Campaign Strategy using the search bar. Something which is completely impossible without a system like this.

tip

We've outlined a naming system here based on our experience working with professional advertising agencies:

Amazon PPC Guide > Advanced > Naming Conventions

We strongly recommend you use this as a starting point if you don't have experience with this.

Your naming convention should be written down in a document that you can share with other team members, or agencies who may be working (or will work) on the same account.

Portfolio Grouping

Campaigns can be organized into Portfolios. Most people know that. But most of you aren't doing it, and that's a waste. In fact I don't think i've ever seen an account that reliably organizes all of it's campaigns into portfolios.

Consider that Portfolios can be assigned budgets, and also that you could organize your Portfolios by campaign strategy. That would give you a way to set universal budgets per campaign strategy... or product category... or however else you choose to group them. A powerful tool that most don't take advantage of reliably.

2: Single Ad Group Catch-All campaigns

Catch-All campaigns are a great strategy, but chances are you're doing it wrong.

info

If you're not sure what a Catch-All campaign is (AKA Backstop, AKA Safety Net) you can learn about it here: Amazon PPC Guide > Intermediate > Campaign Strategies

It is a very common mistake with Catch-All campaigns to put all the products into one ad group. You must still organize the products and their relevant targets into separate ad groups. Otherwise if you do win the auction, the product shown may be completely irrelevant to the target match (You don't get to decide which product from the ad group gets shown).

Additionally you will be less likely to win the auction at all if you are bidding on a product that is not relevant to the target (Keyword, Category, etc).

See Amazon PPC Guide > Advanced > Auction System Theory # Quality Score to learn about the hidden quality score and how it affects bidding.

That leads us nicely into number three.

3: Failure to Understand the Auction System

While the exact technical details of the Amazon Advertising auction system are a closely guarded secret, we are fairly certain that each advertisement is assigned a Quality Score which directly affects the price you pay per click and whether your product is chosen to be shown at all. Some items which are theorized to affect this quality score include:

  • Search Term Relevance - Based on the product description, how relevant is the product to the search term?
  • Product Reviews - Both the quantity of reviews and the average rating.
  • Click Through Rate (CTR) - The percentage of times an ad is clicked on, compared to the number of times it is shown (indicates search term relevance).
  • Conversion Rate (CR) - How often the product sells, compared to the number of times it was clicked.

That means that part of your job as an advertiser is to make sure that the product description is updated regularly to include your top keywords. And that you are doing what you can to get as many reviews as possible.

If you are managing advertisements for someone else and they have bad product photos... say something.

info

Read this post for more detailed Auction System Theory Amazon PPC Guide > Advanced > Auction System

4: Focusing Only On Advertisements

I'm going to generalize here and say that a solid 50% of your time (or more) should be spent on the following:

  • Affiliates
  • Youtube Videos
  • Product reviews
  • Product page (images and description)
  • Online reviews/articles/blogs

Get your head out of the spreadsheets and interact with the rest of the advertising ecosystem. All of these things will raise your quality score, which will lower your bid cost and win you more auctions.

5: Failure to Follow A Plan

You should decide ahead of time what kind of overall strategy you will be pursuing. Short Term vs Long Term profit. I like to call them Bootstrapped vs Venture Capital.

A "Bootstrapped" campaign is one that is profitable from day one, but total sales are lower, and the organic ranking of the product will rise more slowly.

A "Venture Capital" campaign is one that is run at a loss in the short term, but total sales are higher, and the organic ranking of the product will rise more quickly.

info

Read this post for more information about Short vs Long Term profit Amazon PPC Guide > Intermediate > Short vs Long Term Profit

If you are running a VC style campaign, set a budget ahead of time with progress checkpoints. Then stick to the plan. If you planned a short term loss, don't get cold feet. You should have budgeted checkpoints and your expectations at each checkpoint. If you aren't at or near your checkpoints, you can reconsider your strategy. But you should have those checkpoints in place.