
First let's define what we mean by an Amazon Performance Report. A performance report is the combination of the sales data from Seller Central with the advertising reports from Amazon Ads, into one new merged report that gives an overhead view of account and product performance.
The idea is that we cannot get the full picture of how we are performing with just half of the data. The Seller Central reports do not tell us how much we are spending on advertising, and the advertising reports do not tell us what our total sales are. We have to merge the two.
Secondly a performance report will typically include several advertising specific sections, which we will review below.
What does a typical Amazon Performance Report look like?
We will have to generalize a little bit here, because every individual advertising firm or manager will do things a little bit differently. But there are some report details that we know for sure will be in every professional Amazon Performance Report (or should be).
For basically every report section listed here, if you store the data over time you can create a time-series for these values to see how they trend. I'm not going to say this again in every section, so just take note of that now and assume it for every report section listed below.
Account Summary Section
The first key section of the report will typically be the account summary. This will usually have the following metrics aggregated for the whole account over a given time period (typically the last month).
- Total Sales
- Ad Spend
- Ad Revenue
- Ad Revenue Percentage
- ACoS
- TACoS
- ROAS
- Ad Impressions
- CTR
- Ad clicks
- Ad Orders
- Conversion Rate
- CPC
If you're unsure what some of these acronyms are or how to calculate them check out the terminology section of our guide: Amazon Ads PPC Guide > Beginner > Terminology
The majority of these metrics come from the advertising reports, but the absolutely key Total Sales value comes from Seller Central reports and is used to calculate several of the other metrics.
Product Performance Section
A professional Amazon Performance Report will always include a product performance section. This is essentially the exact same as the account summary section, but the metrics are grouped by product.
In fact, performance reports can really only be grouped these two ways (by account and product) because those are the only groupings available to us for Total Sales in Seller Central reports.
Organic vs Ad Revenue Section
This section is intended to show the ratio or volume of organic vs paid revenue over time. The idea being that ideally we want to show an increase in organic revenue as time goes on. This is most informative as a time-series.
Advertising Specific sections
In addition to the merged performance sections that include total sales metrics, there will typically be several advertising only metric sections afterwards.
These sections will typically be a standard set of advertising metrics, grouped in various ways. You can assume the advertising metrics will look something like this:
- Ad Spend
- Ad Revenue
- Ad Clicks
- Ad Impressions
- CPC
- CTR
- ACoS
- Conversion Rate
These metrics can then be grouped by Campaign Type (Sponsored Products, Sponsored Brands, Sponsored Display), target type, target match type and placement.
Gathering data
Bidbear automates the process of downloading and merging this data into comprehensive performance reports. So if you want to skip this busywork and get a bunch of other benefits consider using our service bidbear.io
Seller Central data
Seller Central is where we get our total sales values. To find them log in to Seller Central and then go Menu > Reports > Business Reports. If that menu is not visible, you are logged in with the wrong account, or you have not been given access by the account owner.
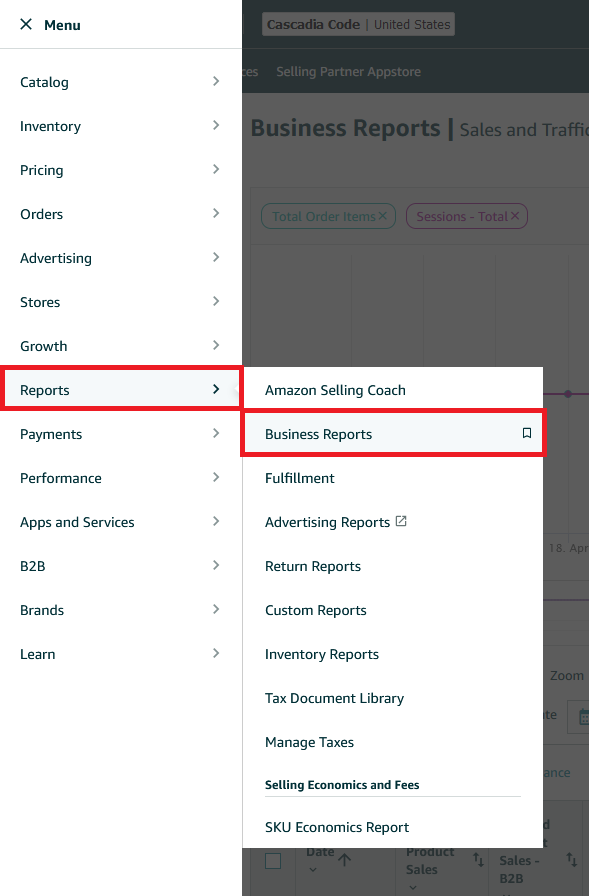
from there the two main reports that you will want to download are the Sales and Traffic report, and the Detail Page Sales and Traffic by Child Item (or parent item if you prefer).
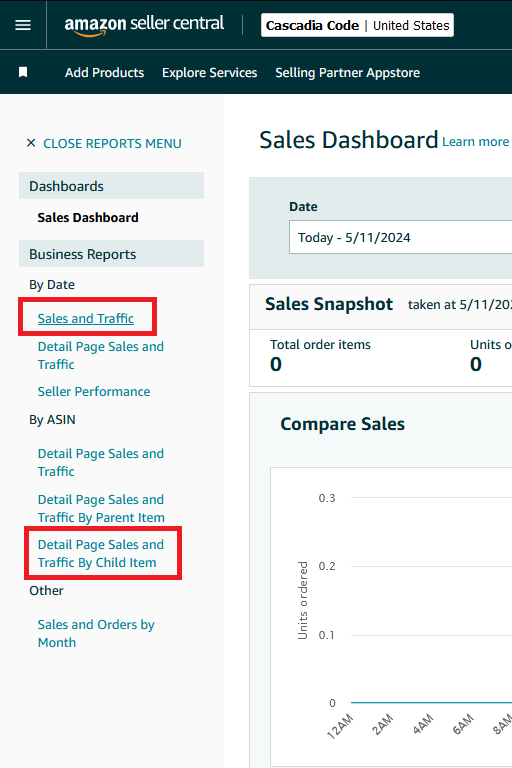
Those will give you the total sales values for the whole account, and by product respectively.
Amazon Advertising data
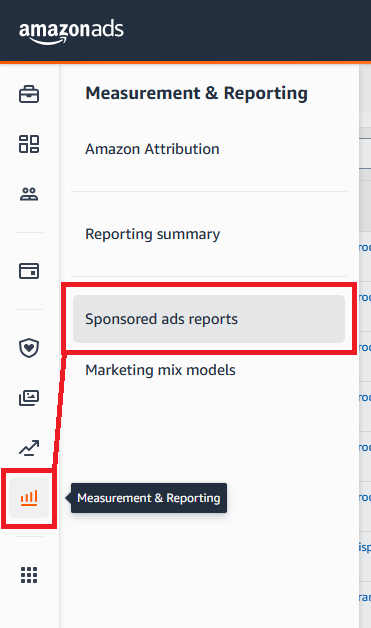
Now let's get all the advertising data. Log into Amazon Advertising and on the sidebar you'll go Measurements & Reporting > Sponsored Ads Reports.
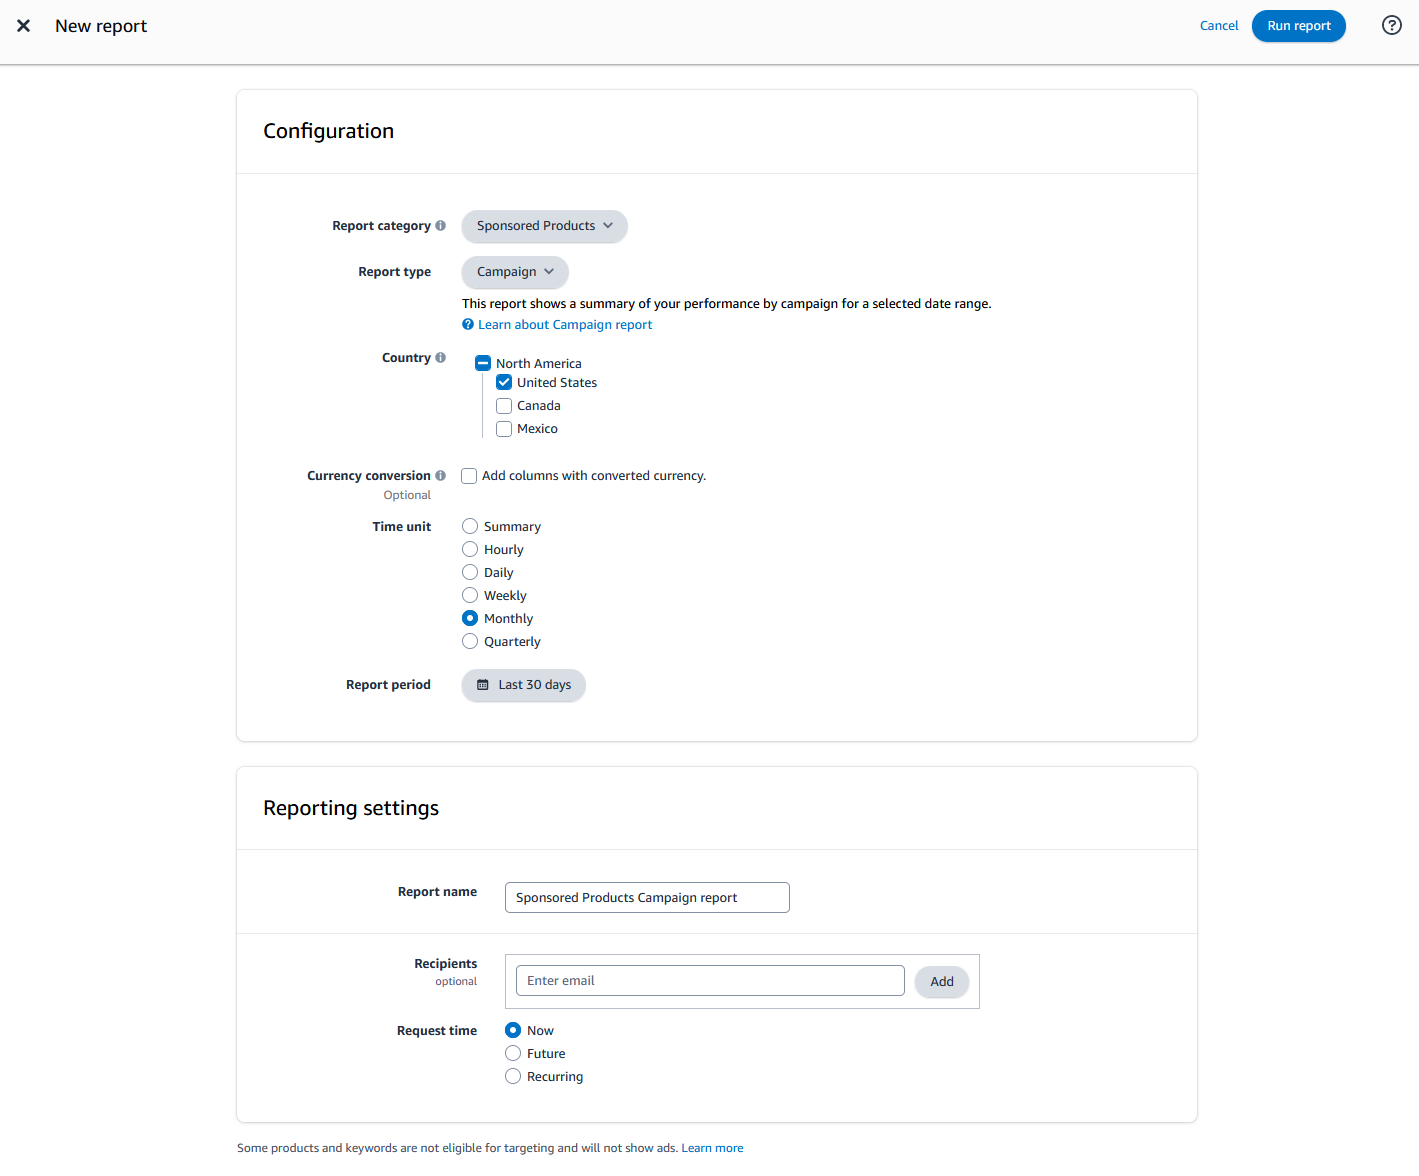
You'll need to create a new report. The reports are segmented by ad type, so you'll need to download three total reports minimum and combine them to get all the data.
For Report Type select Campaign. You will simply sum the total for all the campaigns, and then sum all of those sums for the different ad types to get your total advertising values.
Name the report something you will remember and then next time you can just request this report again.
The report will take a minute to generate, but when it's done you download the three reports (one for each ad type) and combine them together in your spreadsheet.
To get the data grouped by product for the Product Performance section of your report, you will simply repeat this process again, but when downloading the advertising reports set the report type to Advertised Product and the data will be grouped by product.
Conclusion
From here the process is simple, you combine the data in the spreadsheet application of your choice. I recommend you make a new spreadsheet for every type of report you want to make, and then a new tab for each time period. From there you can create a time-series, charts etc etc.
Once all those charts and table are done you combine them all in a presentation software like Powerpoint, and repeat the whole process every month.
If doing this on a monthly basis sounds tedious, check out bidbear.io. We automate this entire process and more.