Summary & Trend
The summary and trend modules are useful for a birds eye view of the item under review. They quickly provide the total value for key metrics, as well as the trend (whether this metric improved or declined) over the previous period.
The total values are over the entire selected period. Shown here is a 90 day period. While the trend values at the bottom indicate the change over this 90 day period. IE, comparing the first 45 days to the second 45 days.
Module Breakdown
The summary module contains the following elements
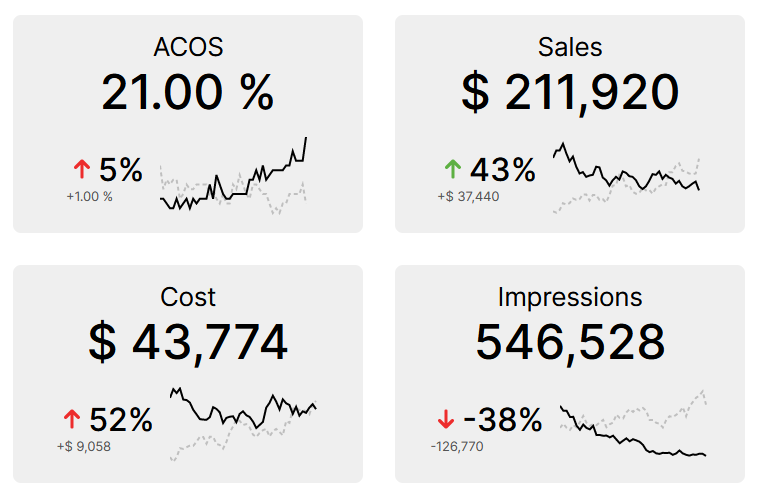
- Total Value - The total value for the given metric over the selected time period.
- Percentage Change - The percentage change for the given metric over the selected time period. The arrow color indicates whether the change in the percentage is positive or negative, which is not always immediately intuitive. For example an increase in sales % is positive, while an increase in ACOS % is negative.
- Value Change - The value of the change over the given time period. In the example above, which is a summary of sales over 90 days, we can see that there were $37,440 more sales in the second 45 days of the period over the first.
- Sparkline - The sparkline chart shows a stacked time-series chart comparing performance over the first half of the period to the second half. The solid line represents the most recent period.